In 2016, the Department of Corrections' Bureau of Planning, Research & Statistics created interactive maps that show inmate admission and releases data by year and committing county. Since then those maps have been maintained, and most recently 2018 data was added.
"Our Bureau of Planning, Research & Statistics, which is headed by Dr. Bret Bucklen, is on the leading edge of technology both in the way it captures data and how it reports data," Corrections Secretary John Wetzel said. "Our goals are to be transparent and to use data to drive policy."
With these maps, everyone can obtain the information and drive down into data that is from their local areas. This helps them to potentially determine needs and services that may be required in the local communities for not only those leaving the state system, but also potentially for those entering the DOC.
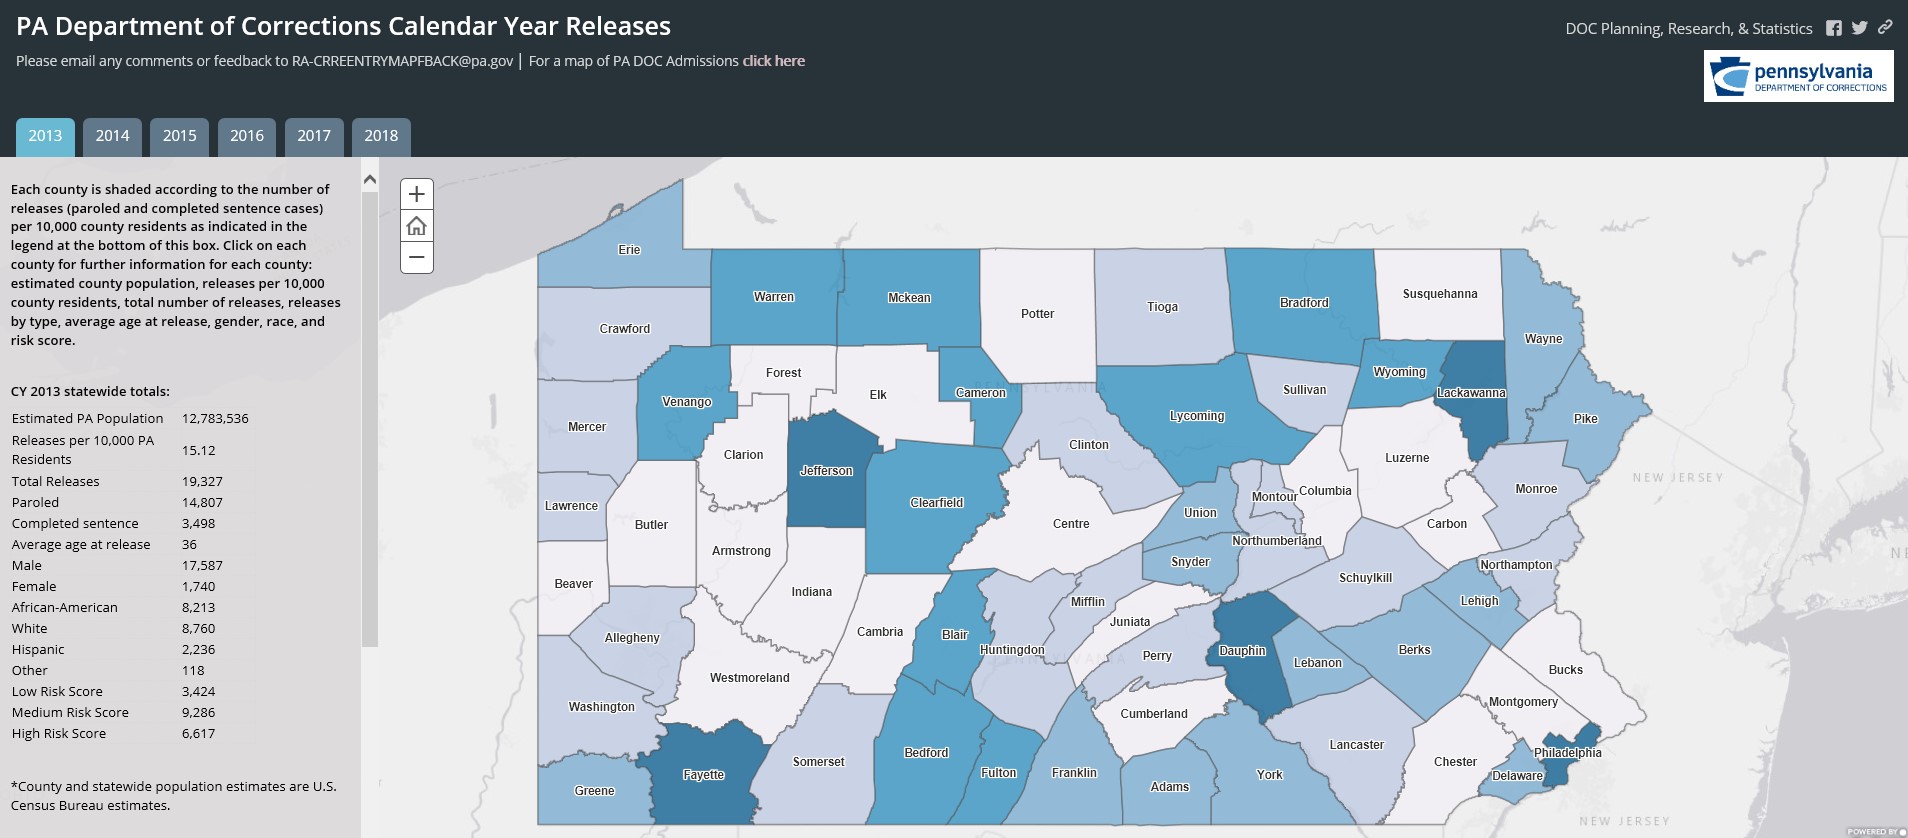
The interactive maps, which are available on the DOC's website, provide statewide admissions and release totals for the years 2013 through 2018, broken down by type of admission, such as new court commitments and parole violators. In addition, individual county information includes gender, race and risk scores.
The risk score is a risk screening tool that was developed and is used by DOC staff to determine an inmate's general risk to reoffend after his/her release from prison. According to the tool, individuals are classified as low, medium or high risk for re-offending. This helps to show the general risk composition of different individuals returning to communities.
The DOC will continue to update both the admissions and releases maps with new tabs as each subsequent year's statistical information becomes available.